Florida licensed drivers, 2006 to 2026
A ten-minute walkthrough of the Power BI file for the colleague who will maintain it: where the data comes from, how 21 PDFs in three layouts become one table through Power Query steps, how the result is checked after every refresh, and how the model is built on top of it.
Setup before the session
- Copy the
final-projectfolder to the presentation laptop. Itsdata\folder already holds all 21 PDFs the model reads. - Open
FL_Licensed_Drivers.pbix, setSourcePathto that laptop'sfinal-project\data\folder, refresh (about one minute), and save. - Open Power Query Editor with the Queries pane expanded and Query Settings visible. Everything in the talk is shown in Power Query Editor, Table view and Model view; the file has no report visuals.
- In a browser, open the FLHSMV reports page and one PDF per layout:
countysexage2006.pdf,countysexage2012.pdf,2026annuallicenseddriverreport.pdf. - Every member rehearses all five parts. If anyone is absent, the others present the whole project between them.
Outline
| Time | Part | Presenter | Topic | Screen |
|---|---|---|---|---|
| 0:00–1:20 | 1 | Javier Alvarez | The business problem: 21 PDFs in three layouts | Browser: FLHSMV page, PDFs |
| 1:20–3:15 | 2 | Gabriel Ponce Nino De Guzman | SourcePath, the year parameters, SourceFiles | Power Query: Parameters, Staging |
| 3:15–5:15 | 3 | Jose Salamanca | Parsers for the long and wide layouts, step by step | Power Query: Walkthrough group |
| 5:15–7:30 | 4 | Fed Sendy Jn Baptiste | The stacked parser, the hand edits, QA Reconciliation | Power Query: Walkthrough; Table view |
| 7:30–9:30 | 5 | Jan Zika | The model: star schema, age brackets, measures; adding a year | Table view, Model view, README |
The business problem
0:00–1:20You are taking over a dataset of Florida's licensed drivers from 2006 to 2026. The state motor vehicle department, FLHSMV, publishes one PDF a year with drivers by county, age bracket and sex. Anyone who wants a trend, such as an insurer pricing young drivers, a county planning a service office, or a driving school sizing its market, would otherwise retype 21 PDFs. The PDFs come in three layouts: wide tables with the ages across the columns, the same with F and M rows stacked under each county, and from 2019 a long layout with one row per county and age. Our file turns all of them into one table of 43,080 rows that refreshes in about a minute.
We will go through the file in the order you will work with it: where the files are read from, how each layout is parsed, how the result is checked, and the model built on top of it.
One parameter, one source
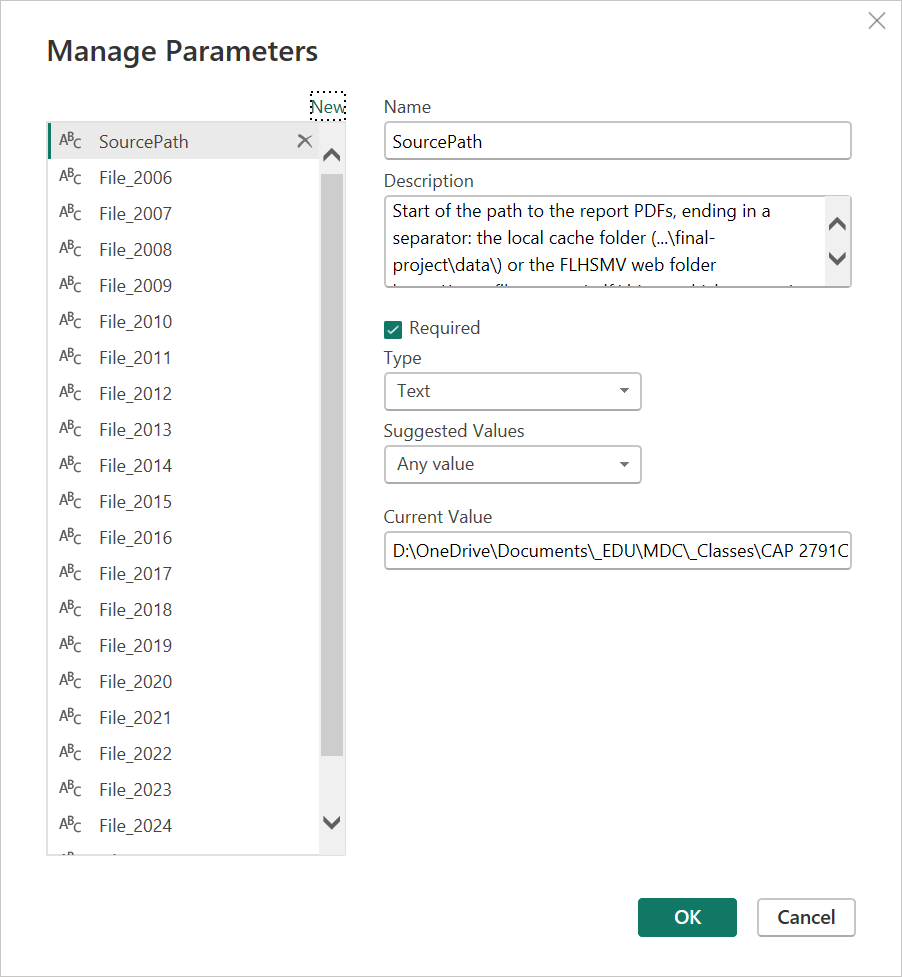
1:20–3:15Start with the setup, because it is what you touch first. One parameter, SourcePath, holds the start of the path to the PDFs, and it is the only value you change. Pointed at the project's data folder, the model reads a local copy of the reports: refresh takes about a minute and works offline. Pointed at the FLHSMV web folder, https://www.flhsmv.gov/pdf/driver-vehiclereports/, the same refresh reloads every report from the original source. Below it, 21 parameters, File_2006 to File_2026, hold each year's file name. The names are the same in both places, so changing the path changes the source and nothing else.
SourceFiles turns the parameters into a table: year, file name, layout and the file itself. If the path starts with http it uses Web.Contents; otherwise it reads the folder once with Folder.Files. Either way the model has one data source, so combining 21 files raises no firewall errors. The first web refresh asks for the privacy level of flhsmv.gov; choose Public. Source Location shows where each year was read from.
The Layout column decides which parser reads each file, and the parsers come next.
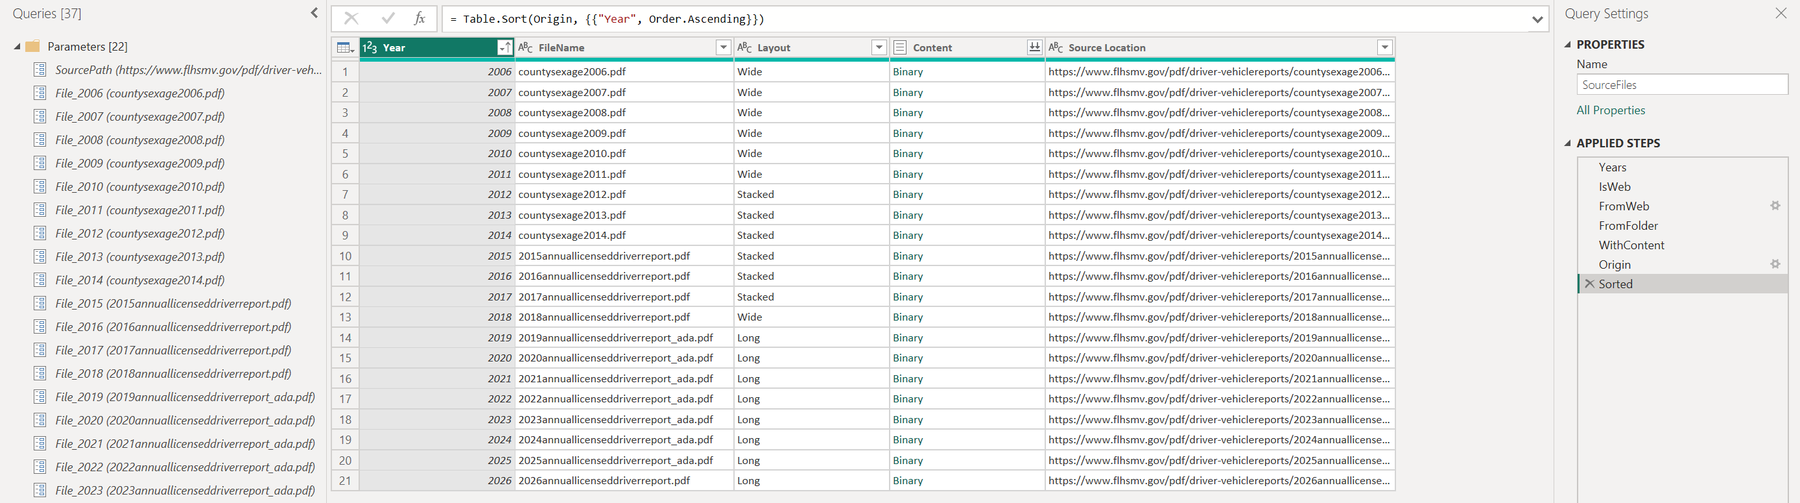
SourceFiles with SourcePath set to the FLHSMV web folder. The Layout column picks the parser: Wide for 2006-2011 and 2018, Stacked for 2012-2017, Long from 2019.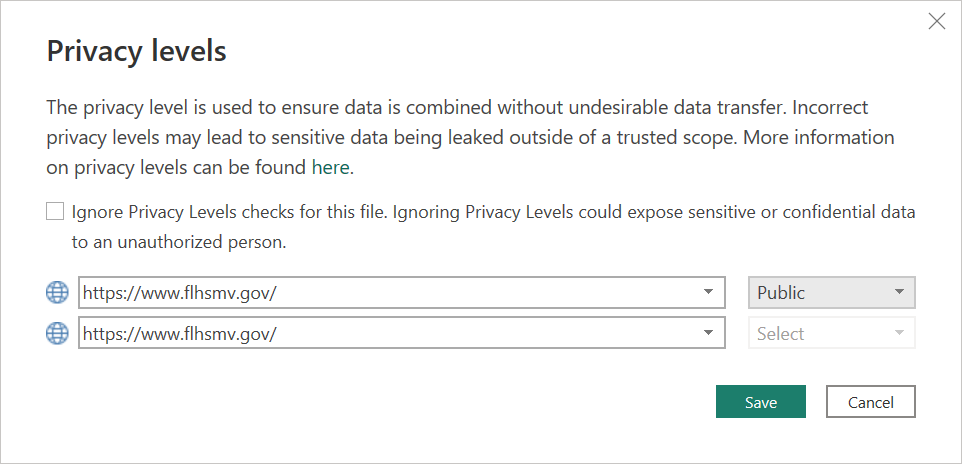
The long and wide layouts
3:15–5:15Each layout has a parser, and each parser has a sample query in the Walkthrough group that runs the same steps on one PDF, so you can click through them in Applied Steps. The long layout is the class ADA query: filter to tables, expand, remove and rename columns, extract the text after "Age", replace " County", unpivot, change type. Two filters, Column3 equals Female and AgeBracket does not contain "to", replace the class version's list of one year's title and total labels, so the same steps work for every year.
For 2019 to 2025 we read the accessible versions, the files ending in _ada. In the wide 2020 and 2021 files, the PDF connector merges the page header into the first row of each page and that row's numbers are lost.
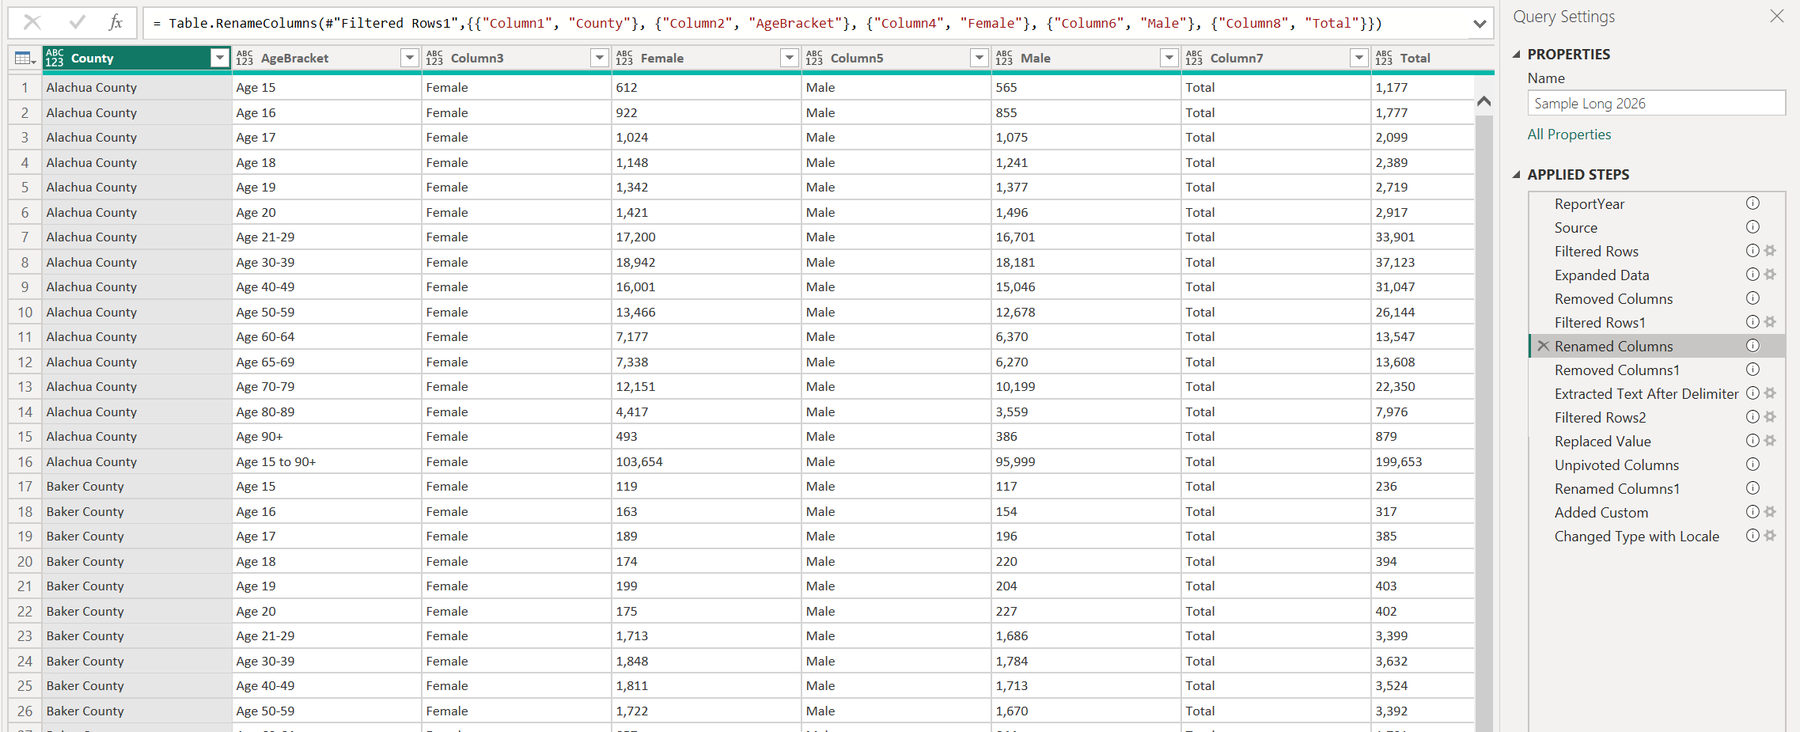
Sample Long 2026 at the filter Column3 = Female. The Applied Steps list on the right is the class ADA query with the two general filters.The wide layout of 2006 shows why the others need more steps. After Expanded Data, the county name is printed only on the F row, with null on the M row. Remove Empty on the last column drops the title, Use First Row as Headers names the age columns, Fill Down copies the county onto the M row, and Unpivot Other Columns turns fifteen age columns into one. Replace Values handles the dash the state uses for zero and spells out F and M.
- Expanded Data
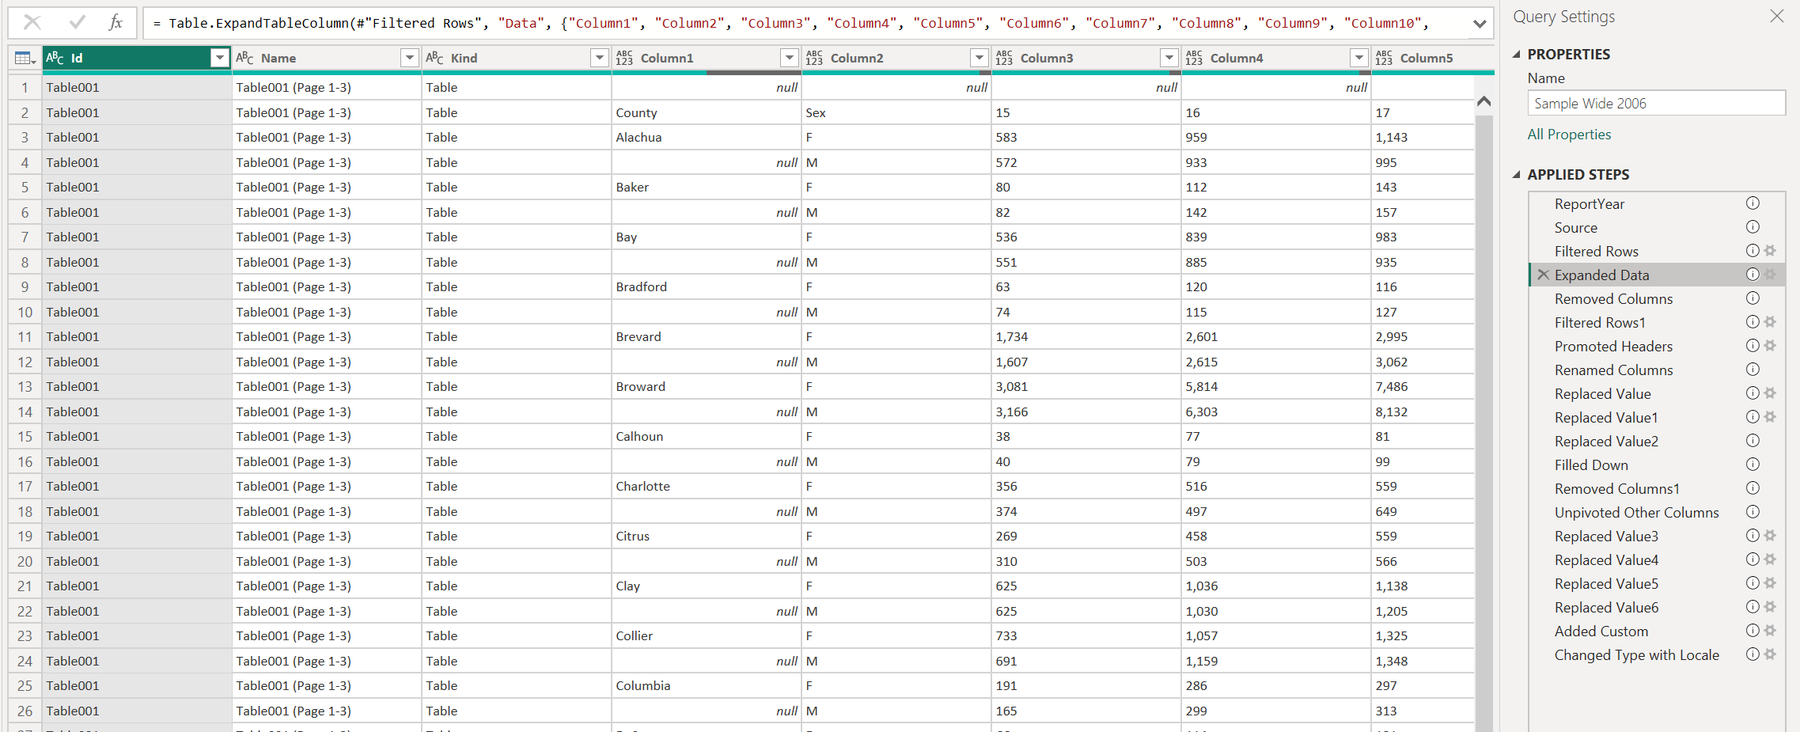
The PDF table as Power Query reads it: the county appears on the F row only. - Promoted Headers
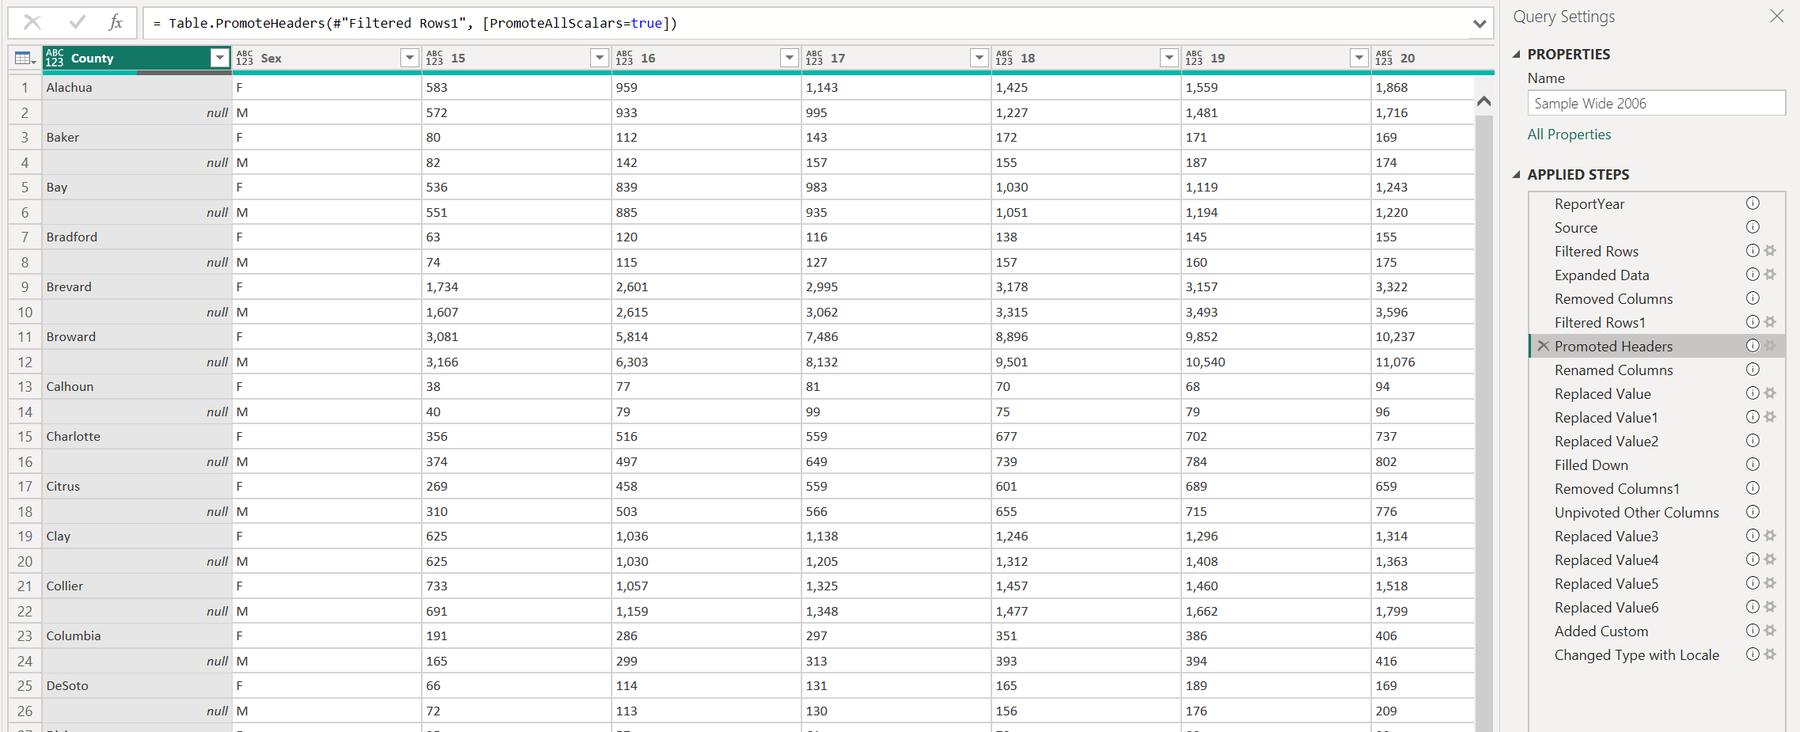
After Remove Empty and Use First Row as Headers, the age brackets are column names. - Filled Down
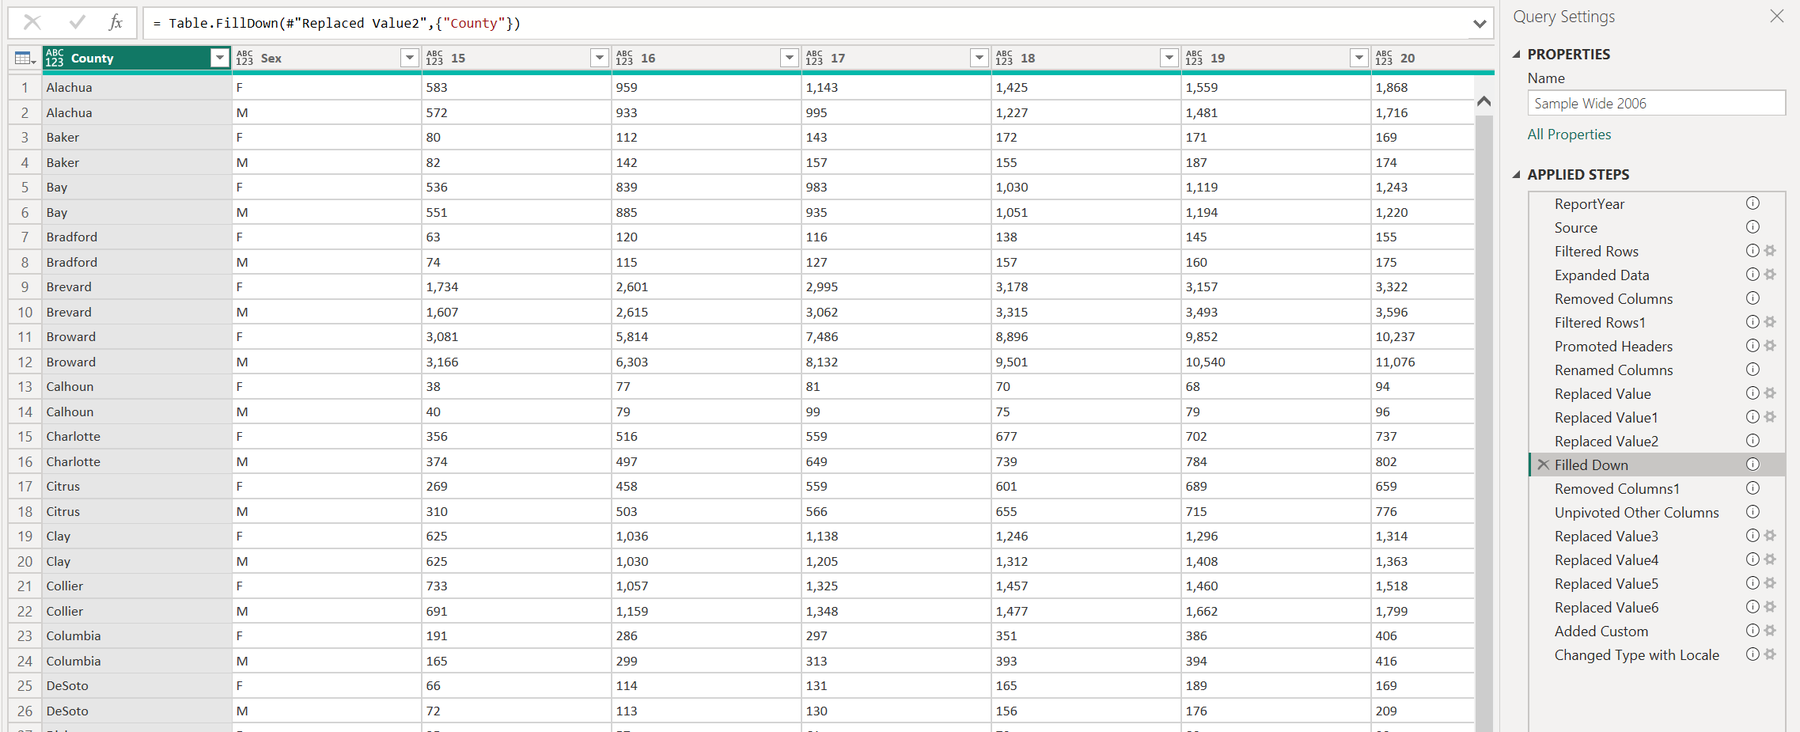
Fill Down copies each county onto its M row. - Changed Type with Locale
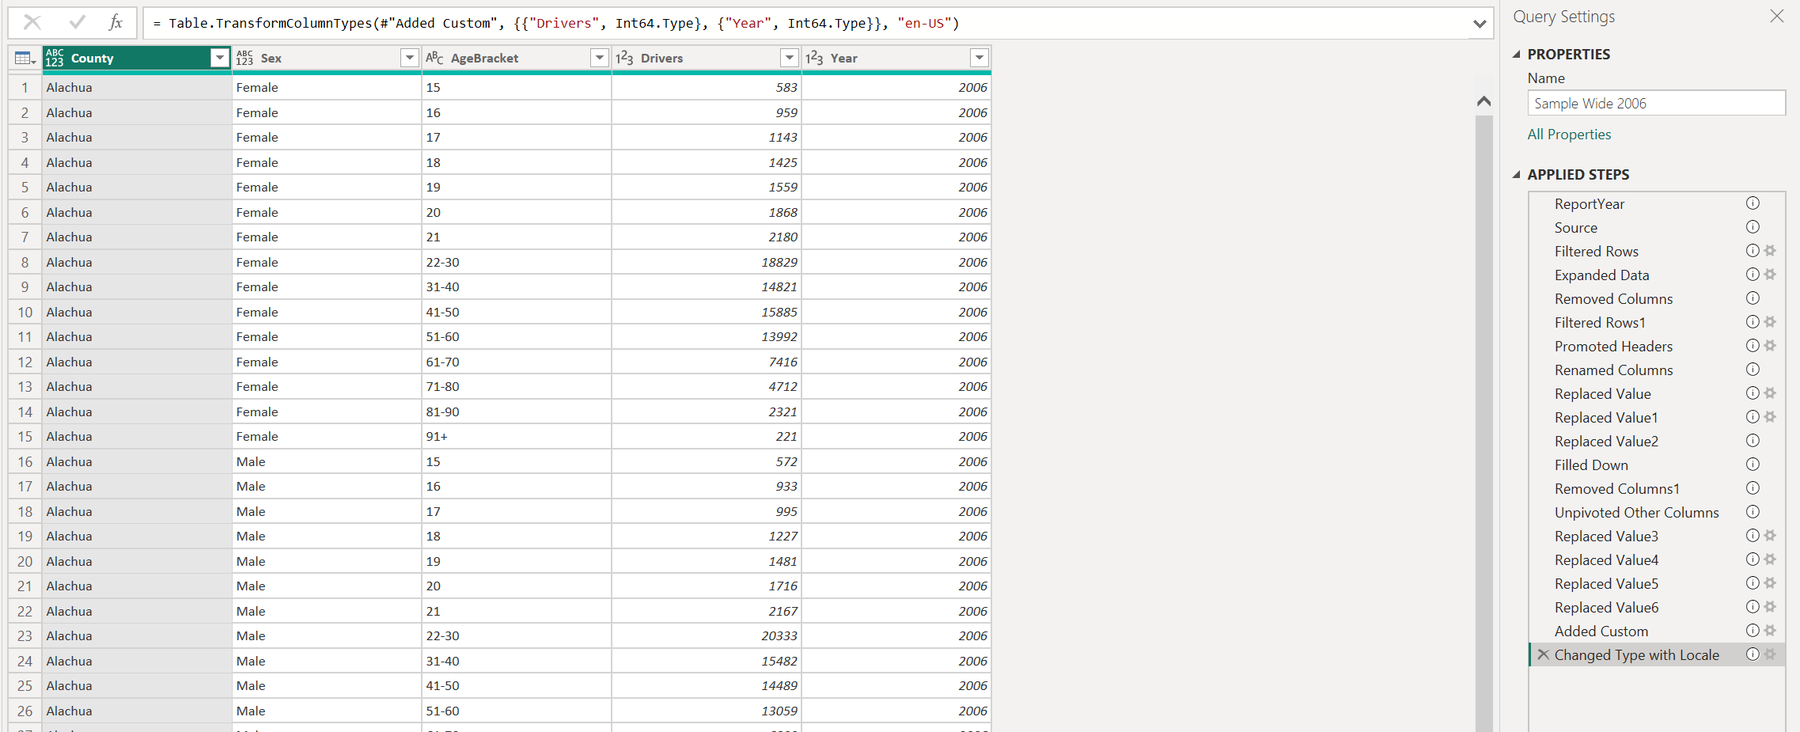
After Unpivot Other Columns, Replace Values and the type change: one row per county, sex and age bracket.
The stacked layout, hand edits, reconciliation
5:15–7:30The stacked layout of 2012 to 2017 puts F and M rows under each county's total row. A conditional column turns F and M into the Sex column, a second one keeps the county name on total rows, and Fill Down spreads it. In 2017 the header repeats on every page; Change Type on the row total turns those rows into errors, and Remove Errors drops them.
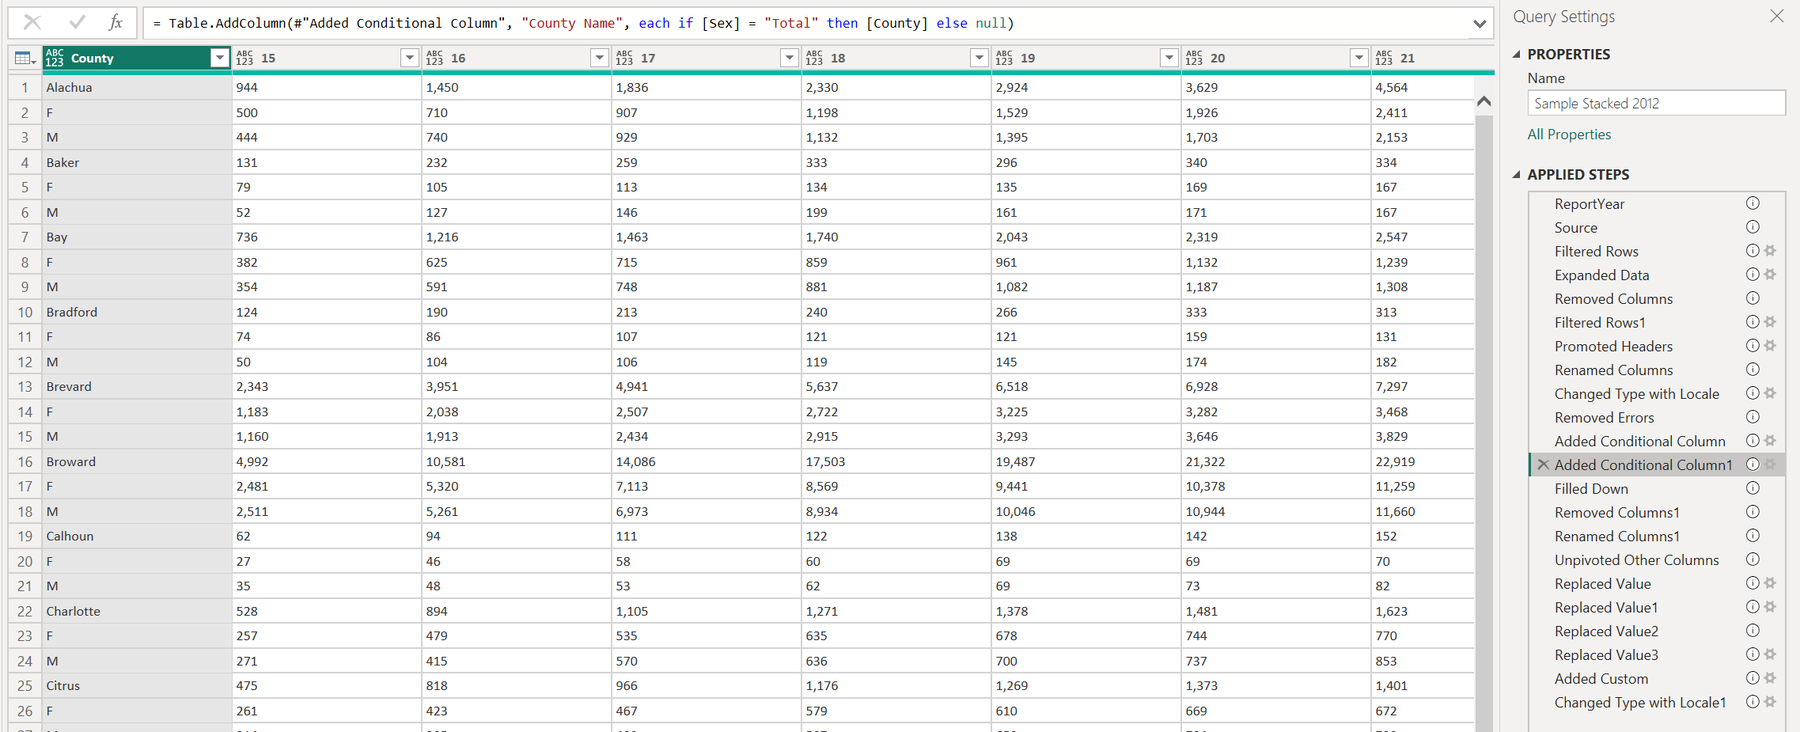
These parsers are longer than anything we wrote in class, so here is exactly what is typed by hand. Every step is a ribbon command except at most three per parser, and those are marked "M edit" in each step's description. They are one-line changes in the formula bar: rename columns by position, because their headers change from year to year; take the year from the function's input; label the statewide total row before Fill Down; and, in the 2012 case you see here, relabel a column printed as 21-30 that really holds ages 22 to 30. The functions are the same steps with the PDF and the year as inputs, so if you change a step, change it in the sample and in the function.
| Parser | Years | Steps | Typed by hand (M edit) |
|---|---|---|---|
fnParseLong | 2019–2026 | 14 | Added Custom: the year column |
fnParseWide | 2006–2011, 2018 | 19 | Renamed Columns by position; Replaced Value2: label the statewide row; Added Custom |
fnParseStacked | 2012–2017 | 21 | Renamed Columns by position; Replaced Value2: 2012 "21-30" to "22-30"; Added Custom |
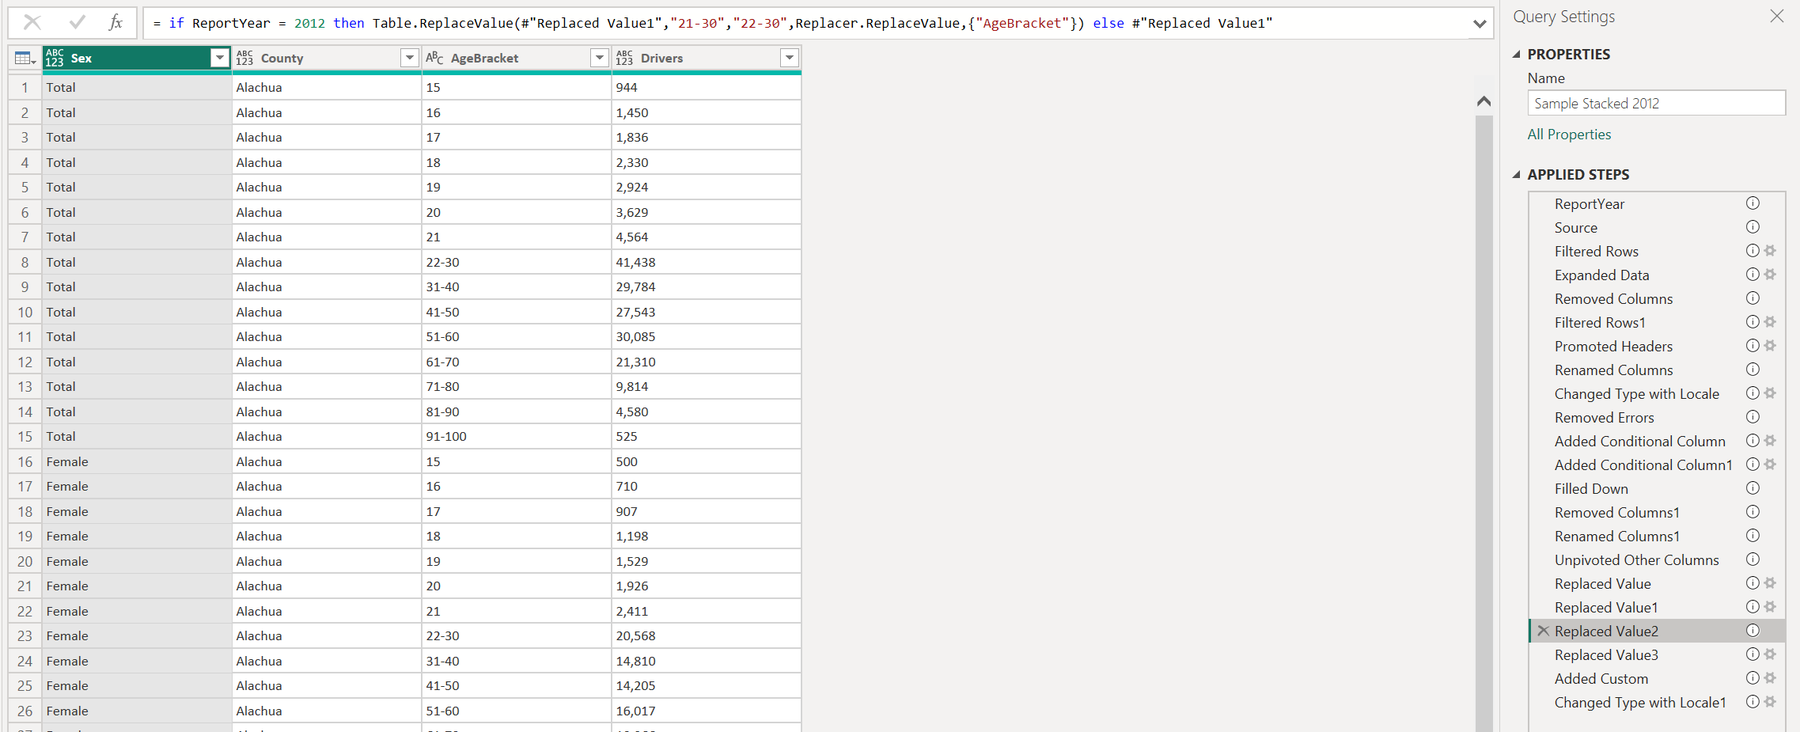
if ReportYear = 2012 then ... else ..., so it applies only to the 2012 report.LicensesStaging runs the right parser for each year and keeps the statewide total printed in each PDF. QA Reconciliation compares that total with the sum of the county rows: all 21 years reconcile to zero. Check this table after every refresh. The Counties column matters too: it should read 69 until 2013 and 68 after, when the Unknown line ends; any other count means a county name was split or left blank.
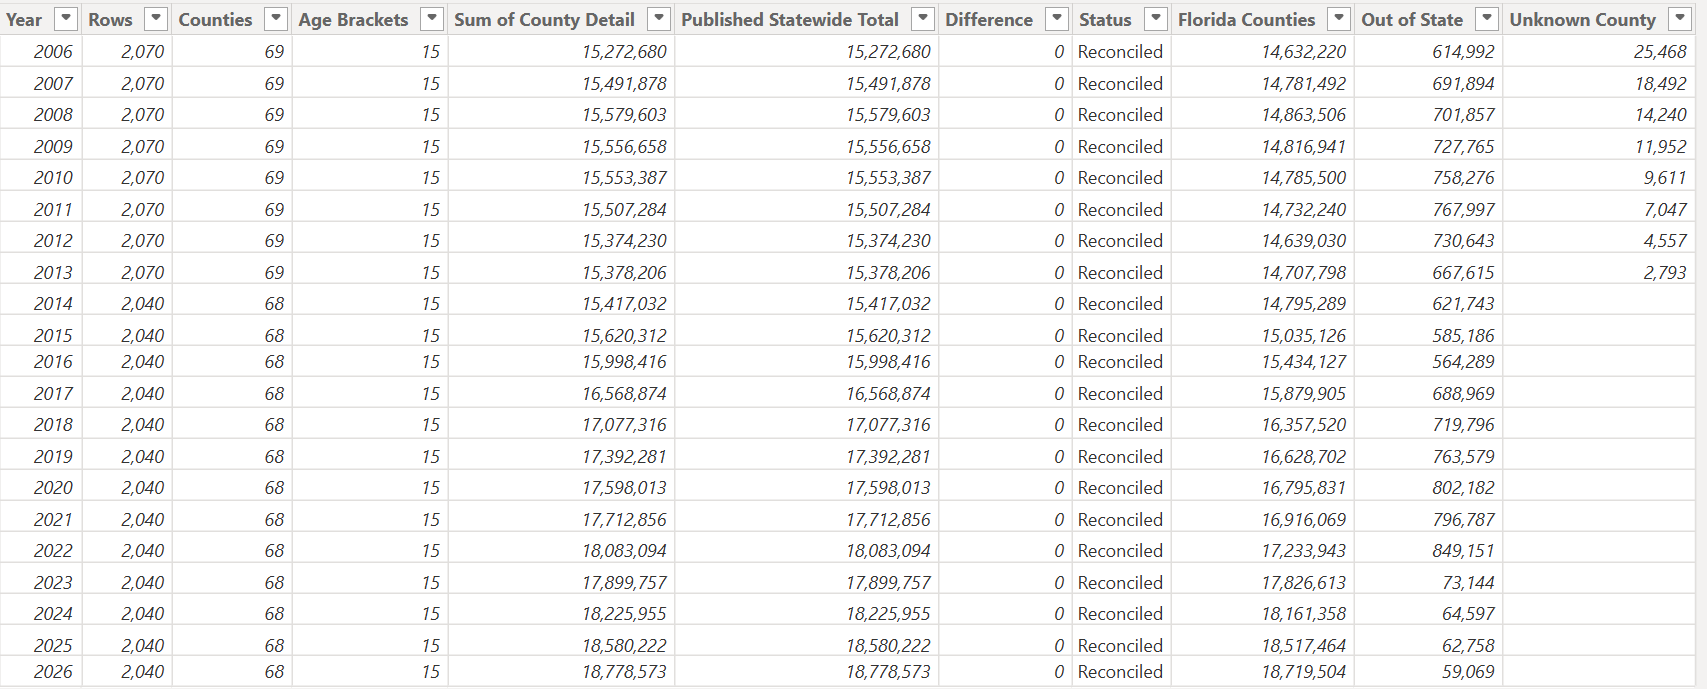
QA Reconciliation in Table view. Difference is 0 in every year; Out of State drops between 2022 and 2023.The model, and adding a year
7:30–9:30The same table shows the data's one break: Out of State falls from 849,151 in 2022 to 73,144 in 2023, a change in how the report counts that line. Florida counties alone grew from 14.6 to 18.7 million over the 21 years.
The model is a star. Licenses is the fact table: year, county, age bracket, sex and drivers, with its keys hidden. County, Age Bracket and Year are built from the fact table in Power Query, so a new county spelling or bracket shows up as a new row.
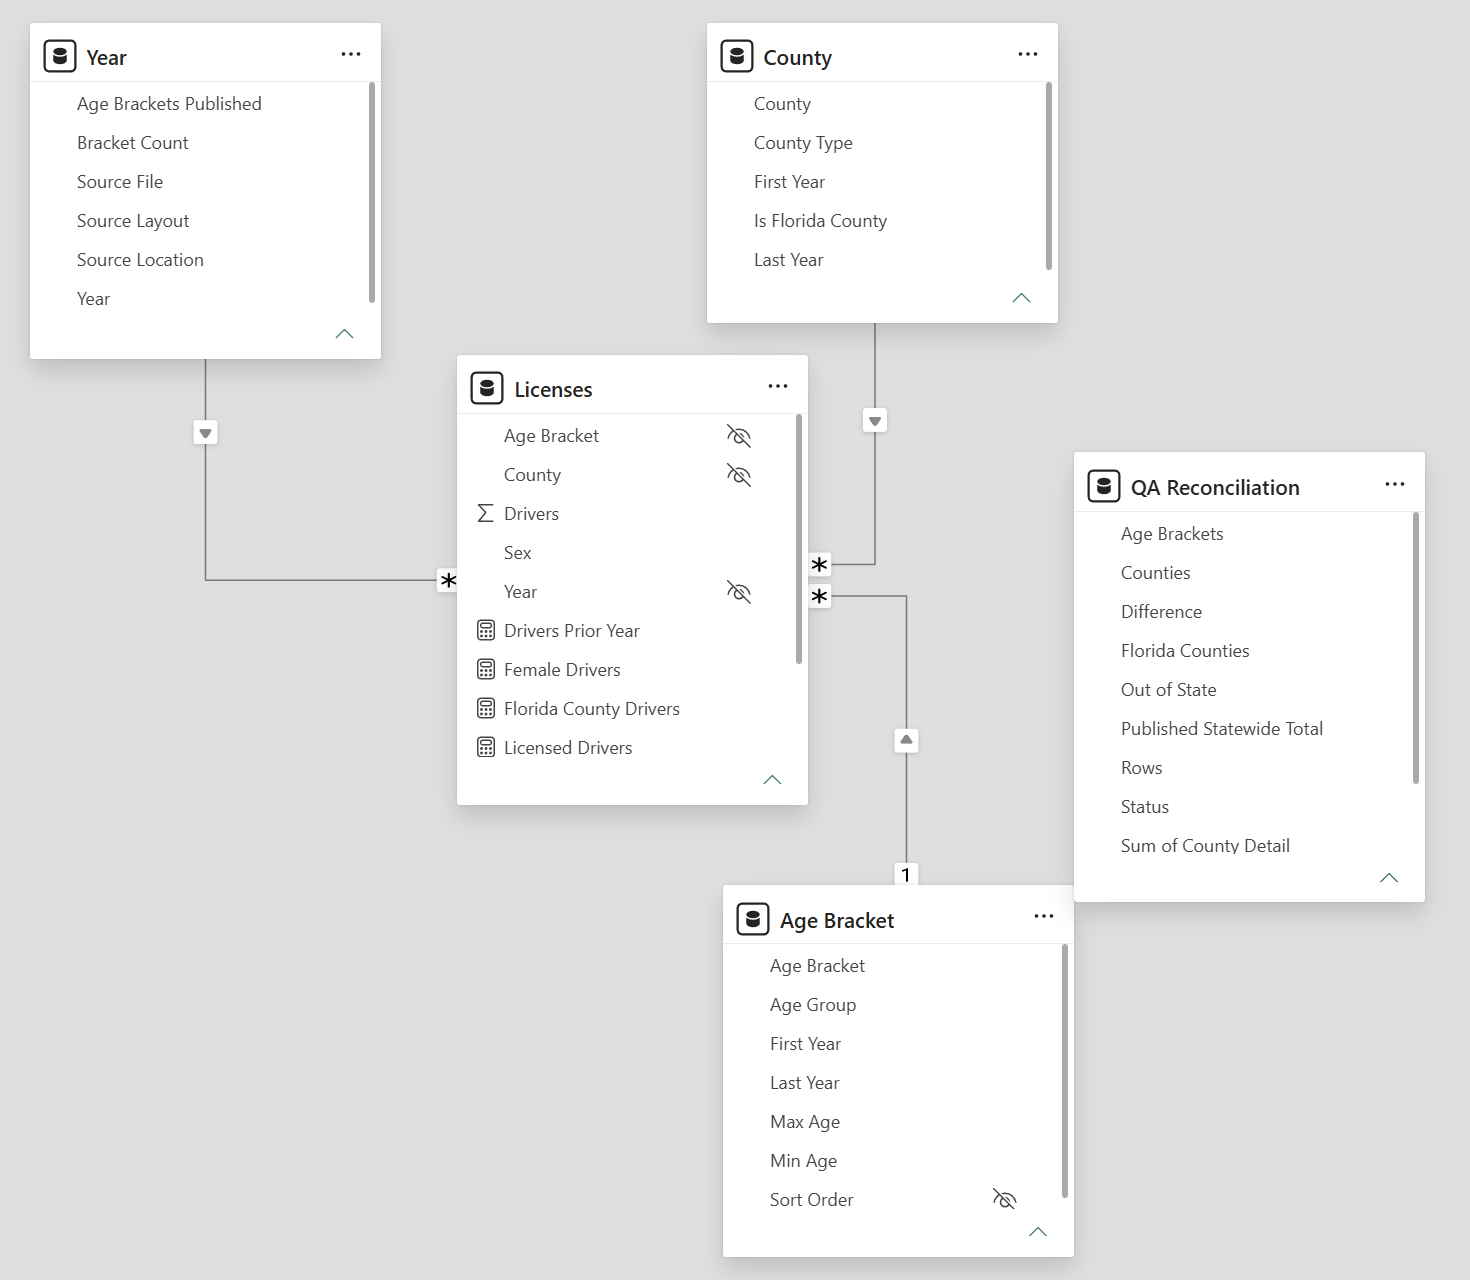
QA Reconciliation is a standalone check table.The age brackets changed twice: until 2012 single years to 21, then 22 to 30; in 2013, 21 to 30; from 2014, 21 to 29. Those schemes cannot be mapped onto each other above 20, so we keep every bracket as published and add an Age Group column with the only groups identical in all years: 15 to 17, 18 to 20, and 21 plus.
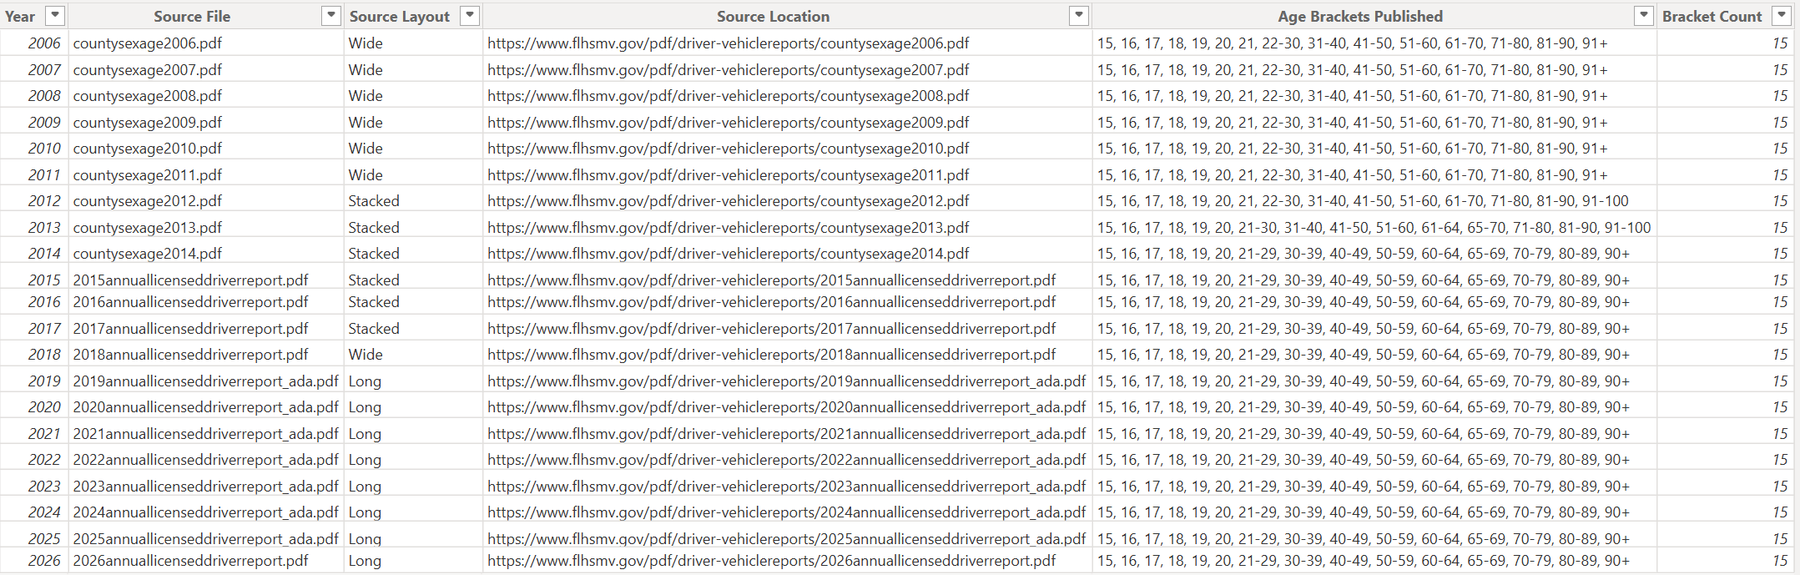
Year table lists the brackets each report published: three schemes, 2006-2012, 2013, and 2014 onward.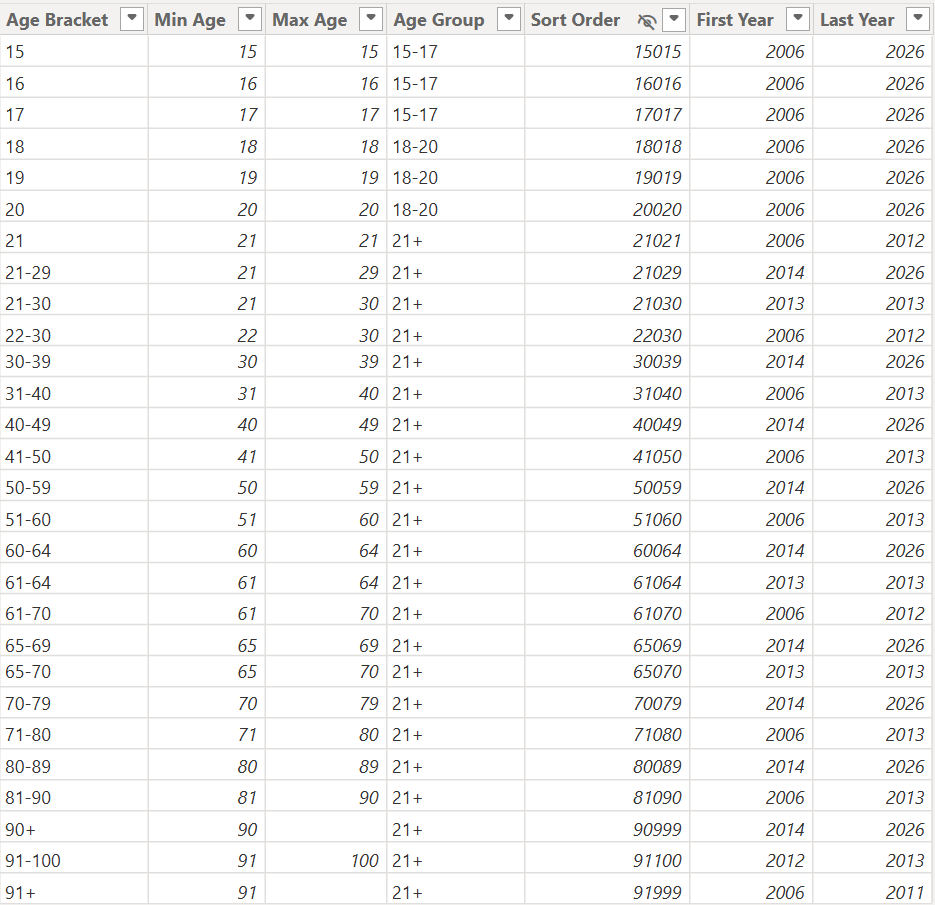
Age Bracket: First Year and Last Year show which scheme each label belongs to.Each report is a snapshot, so the main measure, Licensed Drivers, takes the latest year in the filter context instead of adding years together. Florida County Drivers excludes Out of State and Unknown.
Licensed Drivers =
VAR LatestYear = MAX ( 'Year'[Year] )
RETURN
    CALCULATE ( SUM ( Licenses[Drivers] ), 'Year'[Year] = LatestYear )
To add 2027: save the new report into the data folder, create a File_2027 parameter with its file name, add one row to SourceFiles with its layout, refresh, and check QA Reconciliation. New county spellings go into CountyAliases. The README records every decision and its reason. Thank you; we are happy to take questions.
Likely questions
- Why is the local folder the default rather than the web, as in the class example?
- The local copy refreshes offline in about a minute and keeps the exact files the analysis used. The original source is one parameter change away.
- Why three parsers instead of one?
- Each layout needs a different set of UI steps. Three short chains of ribbon commands are easier to read and fix than one query full of conditions.
- Why keep the sample queries if the functions already exist?
- A function shows no Applied Steps. The samples make every step visible and testable on a real PDF.
- What happens if a file is missing?
- The refresh stops with an error that names the file: "Not found" and the path from the local folder, or the HTTP error and the URL from the web.
- How do you know the 2012 column is 22-30?
- In 2012, age 21 plus "21-30" for Alachua totals 46,002; the 2013 21-30 bracket is 45,813. A column holding 21-30 would double-count age 21.
- What does Out of State mean?
- The reports do not define it. The model keeps it as its own county, and Florida County Drivers excludes it.